Decision Tree Ensembles for Volatility Forecasting
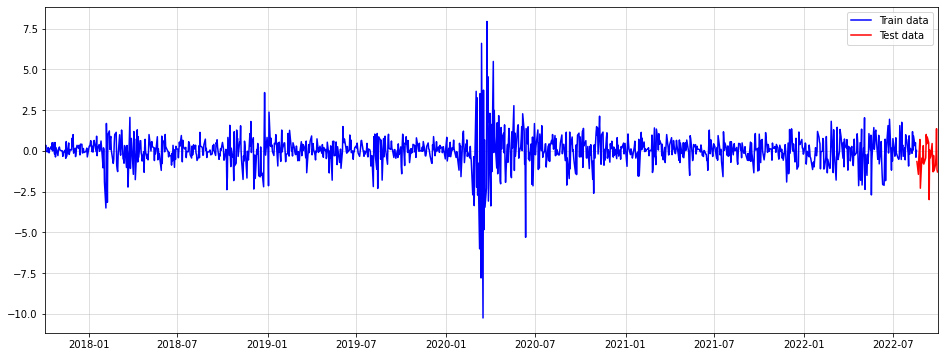
import pandas as pdimport numpy as npimport yfinance as yfimport matplotlib.pyplot as pltsymbol ="^DJI"data = yf.download(symbol, start="2017-10-01", end="2022-10-01")returns = np.log(data["Close"]).diff().dropna()n_test =30train = returns.iloc[:-n_test]train_mean = train.mean()train_std = train.std()train = (train-train_mean)/train_stdtest = returns.iloc[-n_test:]test = (test-train_mean)/train_stdplt.figure(figsize = (16,6))plt.plot(train, color ="blue", label ="Train data")plt.plot(test, color ="red", label ="Test data")plt.grid(alpha =0.5)plt.margins(x=0)plt.legend()
[*********************100%***********************] 1 of 1 completed
from sklearn.ensemble import RandomForestRegressorn_lags =5train_lagged = pd.concat([train**2]+[train.shift(i) for i inrange(1,n_lags+1)],1).dropna()y_train = train_lagged.iloc[:,0]X_train = train_lagged.iloc[:,1:]forest_model = RandomForestRegressor(max_depth=3, n_estimators=100, n_jobs=-1, random_state=123)forest_model.fit(X_train.values, y_train.values)
/var/folders/2d/hl2cr85d2pb2kfbmsng3267c0000gn/T/ipykernel_66876/2717592527.py:5: FutureWarning: In a future version of pandas all arguments of concat except for the argument 'objs' will be keyword-only
  train_lagged = pd.concat([train**2]+[train.shift(i) for i in range(1,n_lags+1)],1).dropna()
In a Jupyter environment, please rerun this cell to show the HTML representation or trust the notebook. On GitHub, the HTML representation is unable to render, please try loading this page with nbviewer.org.
from scipy.stats import normsamp_size =50000Xt = pd.DataFrame(pd.concat([train.shift(i) for i inrange(n_lags)],1).dropna().iloc[-1,:].values.reshape(1,-1))Xt = pd.concat([Xt for _ inrange(samp_size)])Xt.columns = X_train.columnsnp.random.seed(123)forest_samples = []for t inrange(len(test)): pred = forest_model.predict(Xt.values).reshape(-1,1) samp = norm(0, 1).rvs(samp_size).reshape(-1,1)*np.sqrt(pred) forest_samples.append(samp) Xt = pd.DataFrame(np.concatenate([np.array(samp).reshape(-1,1),Xt.values[:,:-1]],1)) Xt.columns = X_train.columnsforest_samples_matrix = np.concatenate(forest_samples,1)forest_std = np.std(forest_samples_matrix,0)forest_lower = np.quantile(forest_samples_matrix,0.05,0)forest_upper = np.quantile(forest_samples_matrix,0.95,0)
/var/folders/2d/hl2cr85d2pb2kfbmsng3267c0000gn/T/ipykernel_66876/1944271020.py:5: FutureWarning: In a future version of pandas all arguments of concat except for the argument 'objs' will be keyword-only
  Xt = pd.DataFrame(pd.concat([train.shift(i) for i in range(n_lags)],1).dropna().iloc[-1,:].values.reshape(1,-1))
/var/folders/2d/hl2cr85d2pb2kfbmsng3267c0000gn/T/ipykernel_66876/3495567139.py:4: FutureWarning: In a future version of pandas all arguments of concat except for the argument 'objs' will be keyword-only
  train_lagged = pd.concat([train]+[train.shift(i) for i in range(1,n_lags+1)],1).dropna()
[LightGBM] [Warning] Using self-defined objective function
[LightGBM] [Warning] Auto-choosing col-wise multi-threading, the overhead of testing was 0.000481 seconds.
You can set `force_col_wise=true` to remove the overhead.
[LightGBM] [Info] Total Bins 1275
[LightGBM] [Info] Number of data points in the train set: 1223, number of used features: 5
[LightGBM] [Warning] Using self-defined objective function
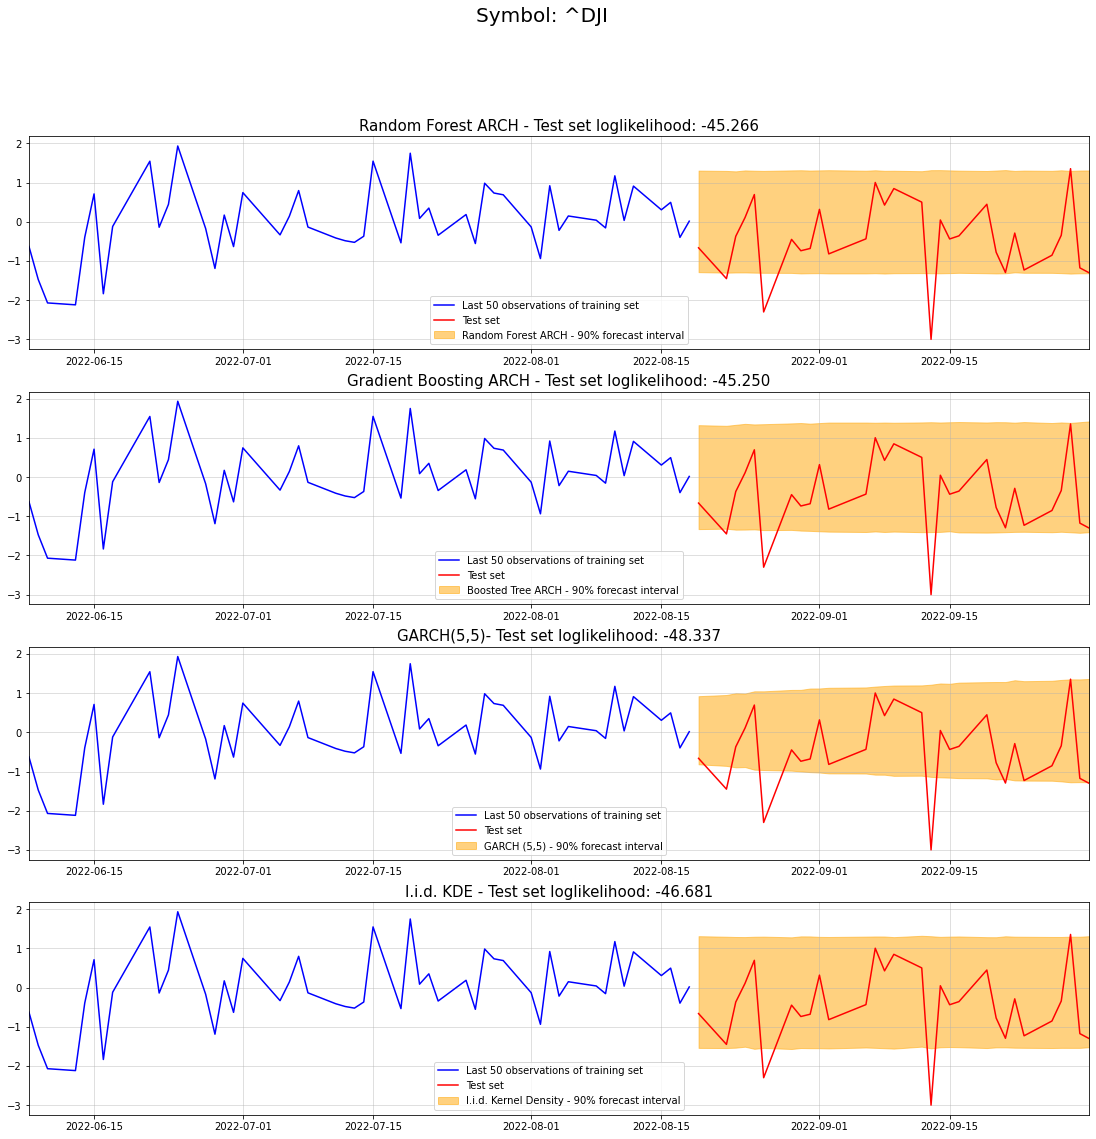
benchmark_lpdfs = [iid_kde.logpdf(test[i])[0] for i inrange(len(test))]garch_lpdfs = [gaussian_kde(garch_samples_matrix[:,i]).logpdf(test[i])[0] for i inrange(len(test))]forest_lpdfs = [gaussian_kde(forest_samples_matrix[:,i]).logpdf(test[i])[0] for i inrange(len(test))]boosted_lpdfs = [gaussian_kde(boosted_samples_matrix[:,i]).logpdf(test[i])[0] for i inrange(len(test))]fig, (ax1,ax2,ax3,ax4) = plt.subplots(4,1,figsize=(19,18))st = fig.suptitle("Symbol: "+symbol, fontsize=20)ax1.plot(train.iloc[-50:], color ="blue", label ="Last 50 observations of training set")ax1.plot(test, color ="red", label ="Test set")ax1.grid(alpha =0.5)ax1.margins(x=0)ax1.fill_between(test.index, forest_lower, forest_upper, color="orange", alpha=0.5, label="Random Forest ARCH - 90% forecast interval")ax1.legend()ax1.set_title("Random Forest ARCH - Test set loglikelihood: {}".format(str(np.sum(forest_lpdfs))[:7]), fontdict={'fontsize': 15})ax2.plot(train.iloc[-50:], color ="blue", label ="Last 50 observations of training set")ax2.plot(test, color ="red", label ="Test set")ax2.grid(alpha =0.5)ax2.margins(x=0)ax2.fill_between(test.index, boosted_lower, boosted_upper, color="orange", alpha=0.5, label="Boosted Tree ARCH - 90% forecast interval")ax2.legend()ax2.set_title("Gradient Boosting ARCH - Test set loglikelihood: {}".format(str(np.sum(boosted_lpdfs))[:7]), fontdict={'fontsize': 15})ax3.plot(train.iloc[-50:], color ="blue", label ="Last 50 observations of training set")ax3.plot(test, color ="red", label ="Test set")ax3.grid(alpha =0.5)ax3.margins(x=0)ax3.fill_between(test.index, garch_lower, garch_upper, color="orange", alpha=0.5, label="GARCH (5,5) - 90% forecast interval")ax3.legend()ax3.set_title("GARCH(5,5)- Test set loglikelihood: {}".format(str(np.sum(garch_lpdfs))[:7]), fontdict={'fontsize': 15})ax4.plot(train.iloc[-50:], color ="blue", label ="Last 50 observations of training set")ax4.plot(test, color ="red", label ="Test set")ax4.grid(alpha =0.5)ax4.margins(x=0)ax4.fill_between(test.index, kde_lower, kde_upper, color="orange", alpha=0.5, label="I.i.d. Kernel Density - 90% forecast interval")ax4.legend()ax4.set_title("I.i.d. KDE - Test set loglikelihood: {}".format(str(np.sum(benchmark_lpdfs))[:7]), fontdict={'fontsize': 15})
Text(0.5, 1.0, 'I.i.d. KDE - Test set loglikelihood: -46.681')